Map, Track and Create Connections in Granular Detail with PatchPro®

DCIM – Data Center Infrastructure Management

A Great Solution with a Strong IT Focus Versus Traditional DCIM

Patchpro® I – Infrastructure Connection Manager

Administer your facilities assets and power usage effectiveness, coupled with unprecedented visualization and access to your network architecture, connectivity, and components:

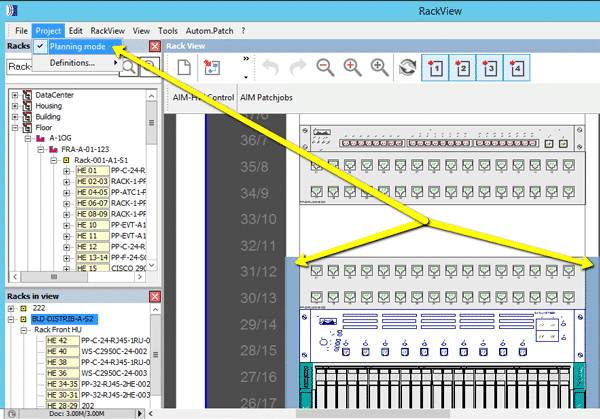
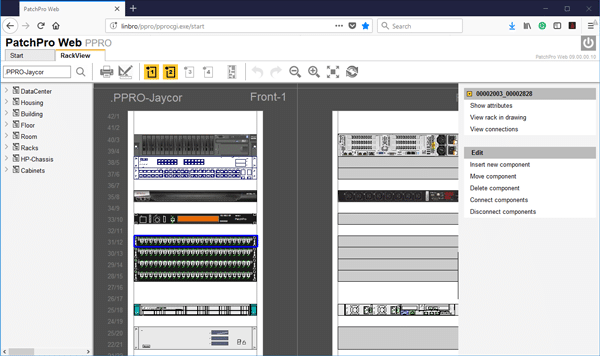
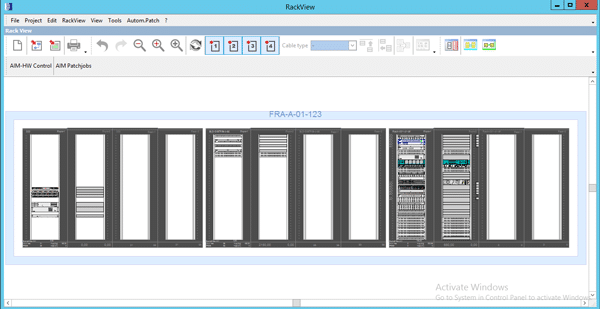
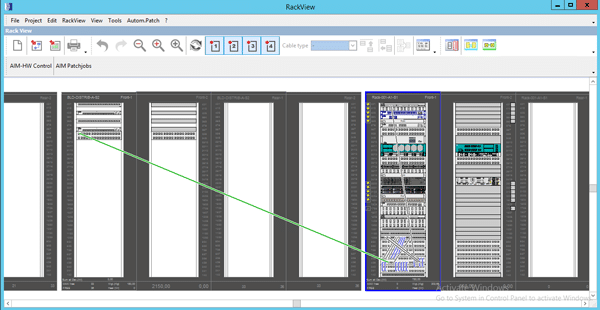
  • Visualize and access racks, inventory and free rack units
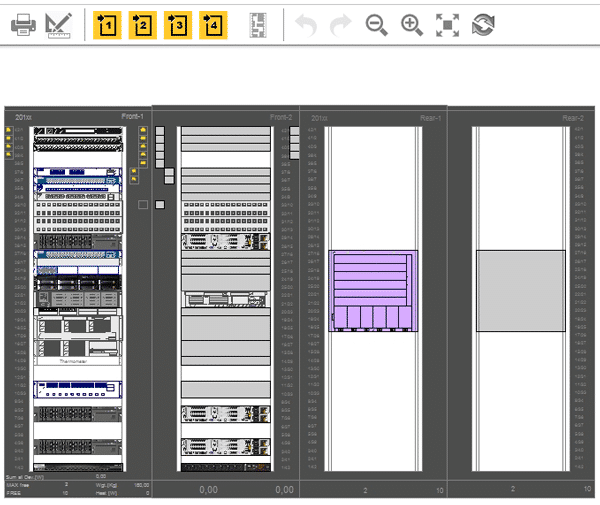
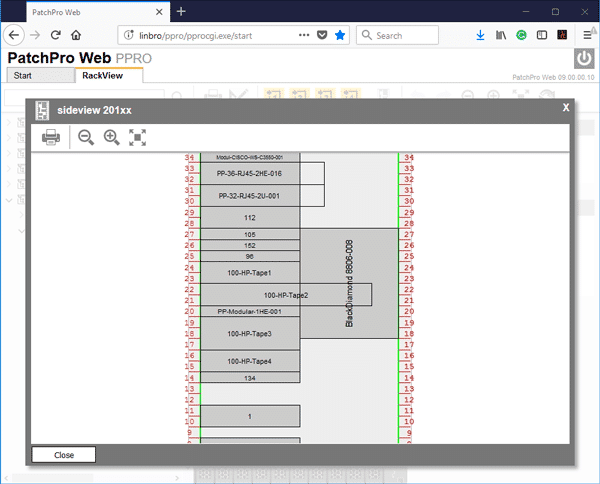
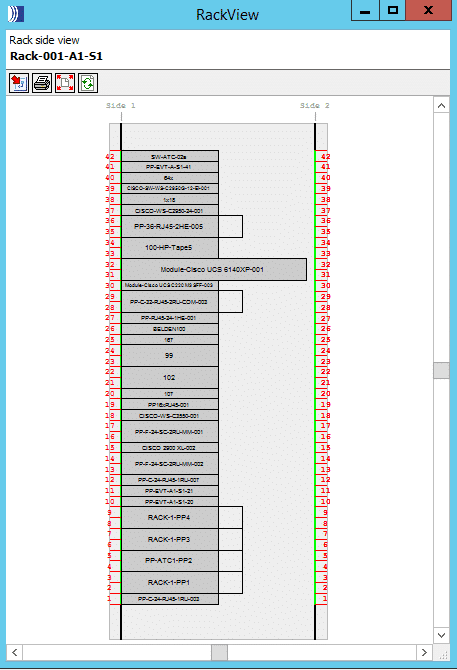
    • Front and rear, back and rear and side views

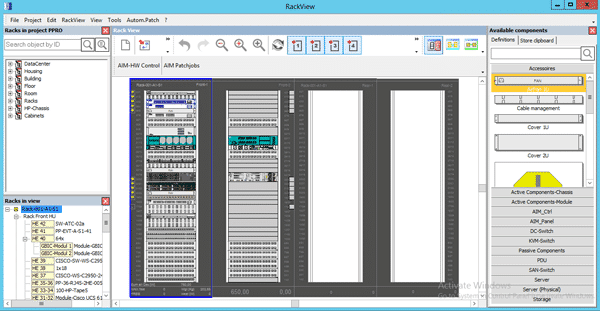
  • Visualize and work on multiple rows, racks, and pods

A Great Solution with a Strong IT Focus Versus Traditional DCIM

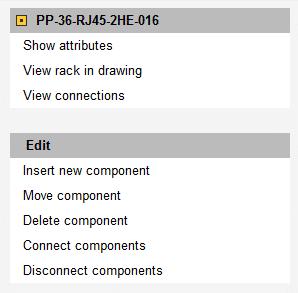
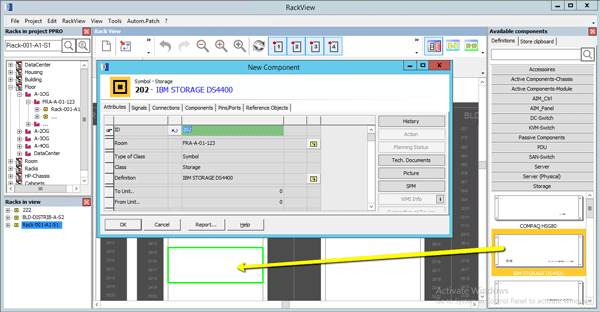
  • Add/subtract components – drag and drop servers, switches, PDU’s, SFP’s Patch panels and more from your component library
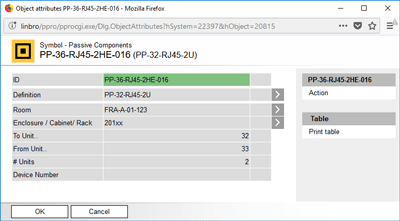
  • New components are saved to the database in real-time with the objects unique set of attributes

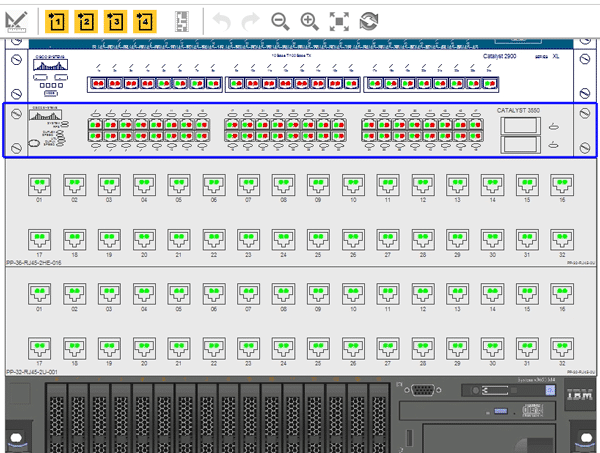
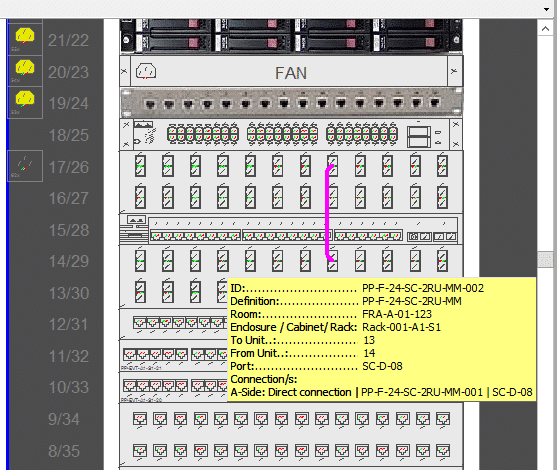
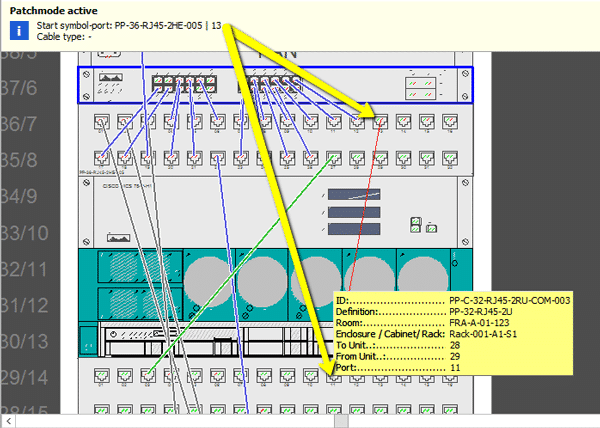
  • Visualize and connect/disconnect free and used ports on devices and patch panels
  • Green – free port
  • Red – connected port

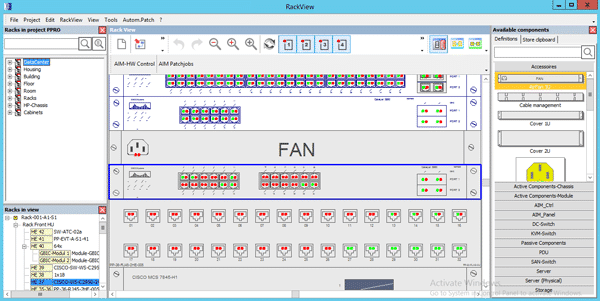
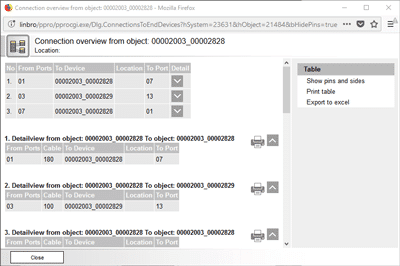
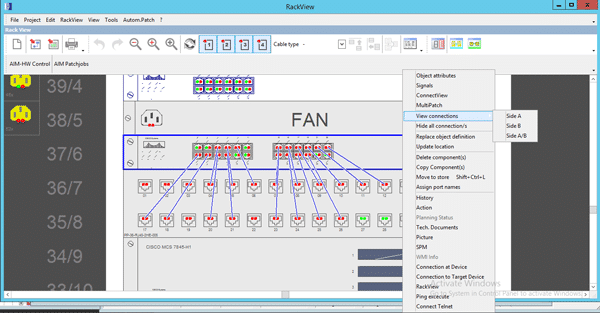
  • Visualize Connections (GUI visually maps connections)
    • Patches between devices within the rack
    • Cross-connects between devices and cabinets
    • Front and Rear Connections
      • ‘View Connections’ quickly visually maps connections
        (Side A, B or A/B)

  • Mouse-hover over free ports to view its connection and the patch objects unique attributes

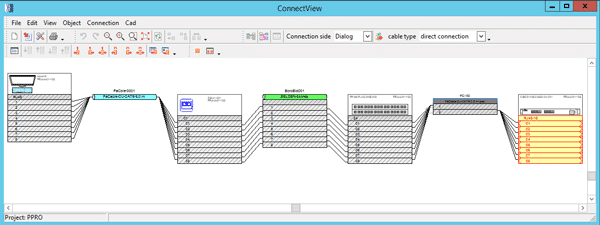
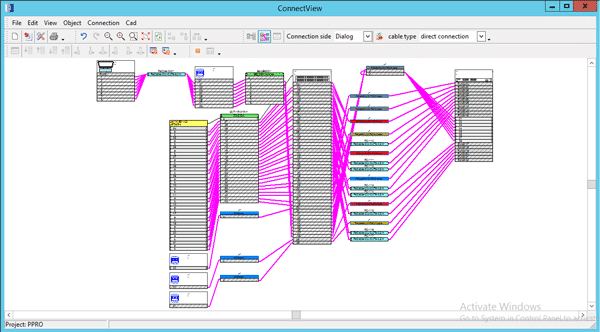
  • Select multiple objects and click ConnectView to map the selections connections
  • Easily export to Microsoft Visio or Excel

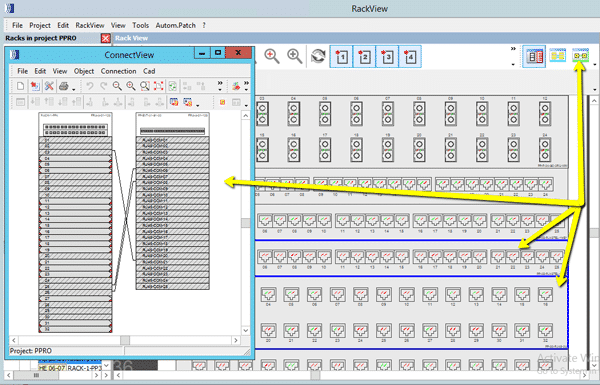
  • End-to-end connectivity literally ‘down to the wire’
    • ConnectView maps any object’s (PC, Server, Switch, cable, port etc.) path from start-to-finish in unprecedented detail

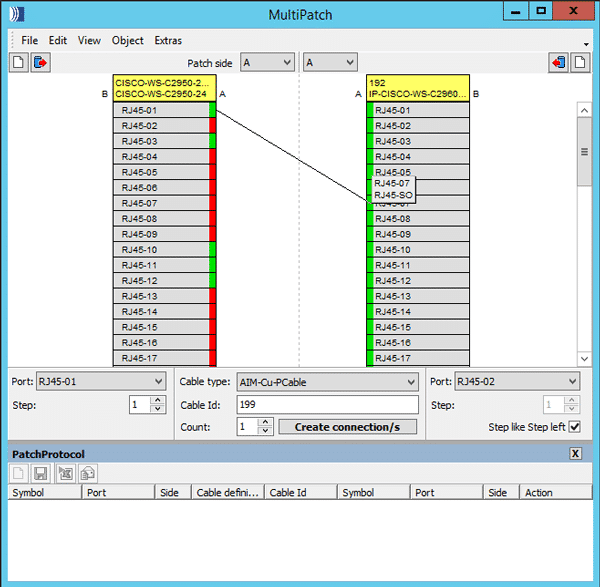
  • Create and visualize patches and cross-connects by clicking on and connecting free ports

  • MultiPatch allows users to create multiple patches between objects, manually or through a .csv (bulk) upload

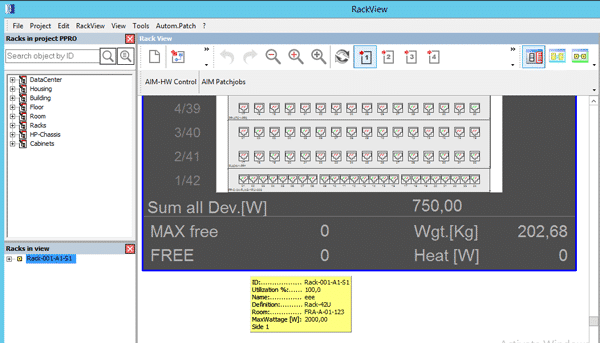
  • Individual racks indicate
  • Total:
    • Energy consumption (W)
    • PDU’s connect via SNMP
    • Weight
    • Free rack units

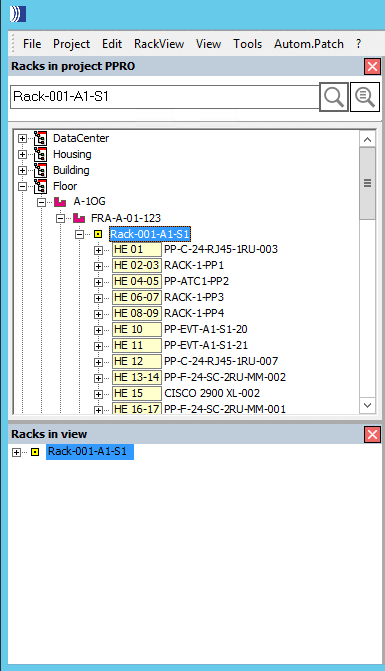
RackView Object Search

  • Search all rack assets using any criteria within the entire facility
    • View the full tree of connectivity from the building down to the device
    • Quickly navigate to the object in RackView by right click or drag & drop into the window
  • RackView – planning mode
    • Design and build your DC and assign work orders to technicians, execute changes once confirmed

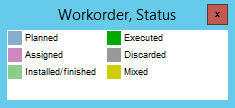
  • Colour indicators on the sides of objects within the rack indicate planned work and the present status
 

1080p Full HD 802.11n Wireless Interactive Presentation Gateway

PLANET WIPG-300H adopting IEEE 802.11n dual-band wireless technology brings smooth display through the 300Mbps high-speed wireless connection or the wired 100Mbps Fast Ethernet connection to project the screen of desktop PC, Mac or smartphone to make the professional and interactive presentation.

Intelligent 1080p Full HD Wireless Projection

The WIPG-300H can optimize resolution based on the automatically transmitting device. It supports the display with multiple resolutions and audio projection disregarding video format and resolution. Its HDMI output resolution can be increased to 1080p (1920 x 1080 pixels), making it a high-definition display perfect for presentation and video. Thus, the office presenter or the home users can easily share the multimedia on the big monitor/screen with others without the hassle of cabling.

Key Features:

  •     Wirelessly project multimedia across different platforms
  •     Flexible dual-output options with VGA or 1080p Full HD resolution
  •     4-to-1 split screen projection increase efficiency
  •     Audio and video streaming
  •     Just Plug & Display by a USB token without any installation
  •     802.11n dual-band Wi-Fi AP and AP-client mode
  •     Remote control presenter’s desktop over USB mouse/keyboard
  •     USB over IP for touch screen and IWB
  •     Web-based management interface
  •     Windows 7/8/10, Mac OS X, iOS and Android support
  •     WebSlides allows multiple users to view the presentation on any mobile devices
  •     SidePad receiver allows a mobile device to remotely control presenter’s desktop
  •     Its compact size makes installation and placement convenient

Wireless Interactive Touch

Furthermore, the WIPG-300H adopts an interactive feature with IWB (Intelligent White Board) and Mobile apps which enable users to reverse control or synchronize screen display for different platforms. This helps the WIPG-300H achieve a real, full wireless presentation environment.

Mobile Applications

The WIPG-300H supports not only the Windows and Mac platforms, but also the presentation and screen mirroring through the iPad, iPhone, or the Android mobile device. Apps for mobile devices working on the WIPG-300H are freely available at Google Play and Apple App Store.

Flexible Projection via Dual Video Output Interfaces

To deliver a perfect presentation solution, the WIPG-300H offers the choice of the two types of video output interfaces: the VGA or HDMI connector, which is compatible with most of the popular display devices. With the hardware decoding capability, the WIPG-300H can project high-definition sound film through wireless or wired LAN connections. It facilitates multiple users to freely display the presentations, images and videos via connecting to a projector or LCD TV without complex installation.

Remote Desktop

Plug standard USB keyboard or mouse into the USB port on the front panel of the WIPG-300H to enable you to control your PC remotely. You don’t have to stand still beside the PC or the WIPG-300H, thus delivering your presentation easily and freely.

4-to-1 Split Screen Projection

With this 4-to-1 split screen feature, the WIPG-300H allows up to four PC / Laptop screens to be projected through one projector at the same time. Therefore, the participants can easily do the side-by-side comparison from four PCs/laptops to make the presentation more efficient.

Empower your Data Centre Collocation Customers with PatchPro® Web

Real-time Online Access to Hosted Infrastructure

PatchPro® Web application provides a collocation data centre’s clients access to their hosted infrastructure, online through a user-friendly web interface. An amazing tool for empowering DC customers to access and view their network infrastructure, servers and other devices. View free ports and rack units, create patch or cross-connects between devices and send workorders direct to the NOC.

The results:

  • Provide Visibility
  • Improve Efficiency
  • Empower Customers

Web Features

Front (and back) and rear (and back) views provide full visibility of all hosted infrastructure within the rack.

– user level access restricts collocations customers from accessing and viewing other customers infrastructure.

Side rack view provides visibility in ensuring no conflicting space requirements apply, when adding additional hardware components.

Visualize connections in granular detail:

– Connected/open ports (front and back) visually

– All connected devices

– Export to Excel/Visio

Customers manage their infrastructure and connectivity

– Components (Servers, switches, SFP’s)

– Create Connections (Patches & Cross-Connects)

Access unique attributes for all connected devices


Additional Benefits of PatchPro® SaaS

  • SaaS (Software as a service)
    • No capital investment in licensing, hardware, staff and training required to execute
    • Contract based on your scope of work and customized for your requirements and budget
  • Open API

Other Modules (Included)

  • PactchPro® F – Facilities Manager
    • Infrastructure physical Layer management (iPLM)
  • PatchPro®I – Infrastructure Connection Manager
    • Data Centre Infrastructure management (DCIM)
    • Automated Infrastructure Management (AIM)
  • PatchPro® SPM Web
    • Service Plan Manager/Asset Managment


Greg Pokroy

CEO – JAYCOR International

Public vs Private Clouds: How Do You Choose?

An Intel Security survey of 2,000+ IT professionals last year revealed several fascinating information about public and private cloud adoption. For starters, within the next 15 months, 80% of all IT budgets will have some income dedicated to cloud solutions.

Many enterprises are starting to rely on public and private clouds for a few simple reasons:

  • Most good public and private cloud providers regularly and automatically back up data they store so it is recoverable if an incident occurs.
  • Tasks like software upgrades and server equipment maintenance become the responsibility of the cloud provider.
  • Scalability is virtually unlimited; you can grow rapidly to meet business needs, and then scale back just as quickly if that need no longer exists.
  • Upfront costs are lower, since cloud computing eliminates the capital expenses associated with investing in your own space, hardware and software.

But before you decide you are moving to the cloud, you should know the differences between public and private clouds. Making a choice between public and private clouds often depends on the type of data you’re creating, storing and working with.


Public Clouds Defined

The public cloud got its kick start by hosting applications online – today, however, it has evolved to include infrastructure, data storage, etc. Most people do not  realise that they have been benefitting from the public cloud for years (before most of us even referred to “public and private clouds”). For example, any time you access your online banking tool or login to your Gmail account, you’re using the public cloud.

In a public cloud, data center infrastructure and physical resources are shared by many different enterprises, but owned and operated by a third-party services provider (the cloud provider). Your company’s data is hosted on the same hardware as the data from other companies. The services and infrastructure are accessible online. This allows you to quickly scale resources up and down to meet demand. As opposed to a private cloud, public cloud infrastructure costs are based on usage. When dealing with the public cloud, the user/customer typically has no control (and very limited visibility) regarding where and how services are hosted.


Private Clouds Defined

In a private cloud, infrastructure is either hosted at your own onsite data center or in an environment that that can guarantee 100% privacy (through a multi-tenant data center or a private cloud provider). In these third-party environments, the components of a private cloud (computing, storage and networking hardware, for example) are all dedicated solely to your organization so you can customize them for what you need. In some cases, you’ll even have choices about what type of hardware is used. No other organization’s data will be hosted using the equipment you use.

With an internal private cloud (one hosted at your own data center), your enterprise incurs the capital and operating costs associated with establishing and maintaining it. Many of the benefits listed earlier about choosing cloud services don’t apply to internal private clouds, especially since you serve as your own private cloud provider.

In organizations and industries that require strict security and data privacy, private clouds usually fit the bill because applications can be hosted in an environment where resources aren’t shared with others; this allows higher levels of data security and control as compared to the public cloud.


What’s a Hybrid Cloud?

Enterprises also have the opportunity to take advantage of both the public and private cloud by implementing a hybrid cloud, which combines the two.

For example, the public cloud can be used for things like web-based email and calendaring, while the private cloud can be used for sensitive data.

Read full article

Better, Faster, Cheaper Ethernet: The Road From 100G to 800G

Worldwide IP traffic has been increasing immensely in the enterprise and consumer division, driven by growing numbers of Internet users, as well as growing numbers of connected devices that provide faster wireless and fixed broadband access, high-quality video streaming and social networking capabilities.

Data centers are expanding globally to support computing, storage and content delivery services for enterprise and consumer users. With higher operation efficiency (CPU usage), higher scalability, lower costs and lower power consumption per workload, cloud data centers will process 92% of overall data center workloads by 2020; the remaining 8% of the workload will be processed by traditional data centers.

According to the Cisco Global Cloud Index 2015-2020, hyperscale data centers will grow from 259 in 2015 to 485 by 2020, representing 47% of all installed data center servers.

Cisco Global Cloud Index

Source: Cisco

Global annual data center traffic will grow from 6.5 ZB (zettabytes) in 2016 to 15.3 ZB by 2020. The majority of traffic will be generated in cloud data centers; most traffic will occur within the data center.

When it comes to supporting cloud business growth, higher performance and more competitive services for the enterprise (computing and collaboration) and consumers (video streaming and social networking), common cloud data center challenges include:

  • Cost efficiency
  • Port density
  • Power density
  • Product availability
  • Reach limit
  • Resilience (disaster recovery)
  • Sustainability
  • System scalability

This is the first in a series of seven blogs that will appear throughout the rest of 2017; in this series, we’ll walk you down the road to 800G Ethernet. Here, we take a close look at Ethernet generations and when they have (or will) come into play.

Read full article

Fiber Infrastructure Deployment: Validate Link Budget

Prior to deploying a new fiber cabling infrastructure, or reusing the installed infrastructure, it’s vital to understand the link budget of the selected speed and transceivers in the new architecture, as well as the desired number of connections in each link.

In new fiber infrastructure deployment, more stringent link budget specifications will need higher-quality passive optical components with reduced channel insertion loss in the link. Typically, the low-loss connector not only allows more connections, but also supports longer links with solid performance.

As you get ready for new fiber infrastructure deployment, there are four essential checkpoints that you should keep in mind:

  1. Determine the active equipment I/O interface based on application types
  2. Choose optical link media based on reach and speed
  3. Verify optical fiber standards developed by standards bodies
  4. Validate optical link budget based on link distance and number of connection points

In a series of blogs, we have discussed these checkpoints. This blog covers the final checkpoint (No. 4): validating the optical link budget based on link distances and number of connection points.


Validating the Multimode Link Budget

The current available ultra-low-loss adaptor is 0.2 dB for MPO-8/12 and 0.35 dB for MPO-24 per connection. These enhancements have been achieved by a combination of new material and polishing methods.

read full article

Budgeting Sufficient Power: Key to Future-proof Fiber Infrastructure

With the technology transformations happening in today’s enterprises, many types of organizations – from hotels and gaming facilities to schools and offices – are deploying new fiber cabling infrastructure.

However, it’s crucial to understand the power budget of the new architecture, as well as the desired number of connections in each link. The power budget indicates the amount of loss that a link (from the transmitter to the receiver) can tolerate while maintaining an acceptable level of operation.

This blog provides you with multimode fiber (MMF) link specifications so you can ensure your fiber connections have sufficient power for best performance. In an upcoming blog, we’ll cover the link specifications for singlemode fiber.


 Attenuation and Effective Modal Bandwidth

The latest IEC and ANSI/TIA standards ratified the maximum cabled fiber attenuation coefficients for OM3 and OM4 to 3.0 dB/km for cabled fiber at 850 nm. Attenuation is also known as “transmission loss,” and is the loss of optical power due to absorption, scattering, bending, etc. as light travels through the fiber. OM4 can support a longer reach than OM3, mainly due to its better light-confining characteristics, defined by its effective modal bandwidth (EMB).

Read full article

Checkpoint 3: Optical Fiber Standards for Fiber Infrastructure Deployment

To reinforce the expanding cloud ecosystem, optical active component vendors have designed and commercialized new transceiver types under multi-source agreements (MSAs) for dissimilar data center types; standards bodies are incorporating these new variants into new standards development.

For example, IEEE 802.3 taskforces are working on 50 Gbps- and 100 Gbps-per-lane technologies for next-generation Ethernet speeds from 50 Gbps to 400 Gbps. Moving from 10 Gbps to 25 Gbps, and then to 50 Gbps and 100 Gbps per lane, creates new challenges in semiconductor integrated circuit design and manufacturing processes, as well as in high-speed data transmission.

Getting ready for new fiber infrastructure deployment to accommodate these upcoming changes, there are four essential checkpoints that we think you should keep in mind:

  1. Determine the active equipment I/O interface based on application types
  2. Choose optical link media based on reach and speed
  3. Verify optical fiber standards developed by standards bodies
  4. Validate optical link budget based on link distance and number of connection points

The first blog published on March 23, 2017 – we are discussing these checkpoints, describing current technology trends and explaining the latest industry standards for data center applications. This blog covers checkpoint No. 3: verifying optical fiber standards developed by standards bodies.

Read full article

Category Cables; Planning for Power Delivery

The utilisation of category cables for power delivery has been getting ample attention lately – especially given the amendment in NEC (2017), NFPA 70 (2017) and potentially CEC C22.1 (2017 proposed revisions). This attention is related to potential safety issues that may emerge when high power, high temperature and high cabling density are present.

The National Fire Protection Association (NFPA), Chapter 3, Table 725.144, “Transmission of Power and Data,” contains information about the ampacity rating of conductors at various temperature ratings based on gauge and bundle size. UL has created LP certifications (optional – not required by code) to identify cables that are designed and tested to carry the marked current under reasonable worst-case installation scenarios without exceeding the cable’s temperature rating.

This arose through an allowance in the older version of NEC, which allowed electricians to substitute Class 2 and Class 3 data cables (category cables) for 18 AWG wire in certain instances.

Read full article

LAN Cabling: Going Beyond Standards to Improve Capacity

Cabling standards exist for a purpose – it assists you get the most out of your networks. Many cabling solutions are designed to execute beyond what the standards specify.

When standards for performance are set by groups like the Telecommunications Industry Association (TIA), the International Organization for Standardization (ISO/IEC) and the Institute of Electrical and Electronics Engineers (IEEE), why go beyond what they advise? Because cable performance which moves beyond standards can lead to a more reliable LAN connection for enterprises.

Bandwidth and Information Capacity

The standards spell out specifications for insertion loss and background noise levels (return loss, near-end crosstalk [NEXT], etc.). If the cable stays within the recommended parameters, the cabling system will function as intended in terms of signal to noise ratio, or information capacity.  For cabling, this is referred to as bandwidth.

Read full article

Copyright © 2024 Jaycor International
Engineered by: NJIN Agency